

Originally Posted on Loves Data’s Blog by Benjamin Mangold
A quick introduction
Social media is an important part of your company’s marketing strategy, whether you run a small business or a multinational company. Social media platforms allow you to engage with your audience, raise brand recognition, and improve leads and sales. As more people utilize social media throughout the world every day, the number of users and social interactions on major platforms continues to grow. Although social media can be a great asset, how well is it really working for you? What’s working? And what’s not working?
This is where Google Analytics (and a few other tricks) can help you get the insights you need. I’m going to share how I track the performance of my own campaigns. And in case you don’t know, I love simple solutions, so I’ve included some tools you might want to use to make your life easier.
Here’s what we will look at in this post:
-
How to track social sharing widgets embedded on your website
-
The importance of using in-built analytics from social networks
Let’s get to it…
Automatically tracking social media with Google Analytics
The first thing to grasp when it comes to tracking social media is what is (and isn’t) monitored by default in Google Analytics.
Let us begin with a basic example…
Assume someone visits your website via LinkedIn (you could substitute LinkedIn with your social network of choice if you like, so this could just as easily be Facebook, Pinterest or another social network).
When someone sees a post with a link to your website, they click the link and are directed to your website. So, how will this user who visits your website appear in your reports? Since LinkedIn is a website that now links to your website, it will be regarded as a referral by default.
Each click through to your website has a source and a medium associated with it. If you’re just getting started with Google Analytics, then source refers to ‘where the message is seen’ and medium refers to ‘how the message is communicated’. For LinkedIn you will have a source of linkedin․com and since this is really a link from another website, the medium will be seen as a referral.
If you head to Google Analytics 4 (GA4) you can adjust the default ‘Traffic Acquisition’ report to show ‘Session Source’ and ‘Session Medium’. And if you search for linkedin.com in the report, you will see something like this:
This shows us the source of linkedin.com with the medium of referral, so we know these users found the website after clicking through from a link that was shared on LinkedIn.
Remember that your social traffic will automatically show up in all of the default acquisition reports and any exploration reports you create in Google Analytics. Here you can see those reports highlighted:
And within the ‘Acquisition Overview’ report, your social traffic will be included in multiple cards. In the example below, your social traffic will be reported as referrals in the ‘News Users by First User Medium’ card (on the left), as ‘Organic Social’ in the ‘New Users by First User Primary Default Channel Group’ card (in the center), and as ‘Organic Social’ in the ‘Sessions by Session Primary Default Channel Group’ card (on the right).
Tracking paid social media campaigns
Now that we’ve looked at the default or automatic reporting, let’s move on to paid social media advertising.
If you’re going to spend on paid ads, you need to be sure you’re tracking and measuring them correctly. This is accomplished through the use of campaign tags, which enable you to track your customized marketing campaigns, which include social media and any other inbound marketing.
All the links in your paid ads on social media need to be customized so they include suitable campaign tags. Campaign tags include the following:
-
Campaign name allows you to define the whole marketing campaign. For example, for Facebook advertising, you might simply call the campaign Facebook Ads, or for a time-sensitive campaign, you could call it Spring Promotion or something similar. It’s worth noting that how you name your campaign is entirely up to you, so go with what you want to see in your reports. If you’re undecided, my advice is to go with something logical and easy to interpret.
-
Campaign source and medium are just like the default source and medium we covered earlier in the post. Remember that source is where the message is seen and medium is how the message is communicated.
-
Campaign ID lets you assign your own identifier to your campaign. It is optional, but if you plan on uploading cost data to Google Analytics, then you’ll need to have it defined in your campaign tags.
-
Campaign content is optional, however it can be useful to identify clicks from different ads if you have multiple ads running on a social network. For example, if you have an ad with a ‘Register Now’ button and another with a ‘Learn More’ button, you can use the content tag to separate the results from each ad in your Google Analytics reports.
If you’re interested in using campaign tags for your other marketing, then read my in-depth post on correctly tracking campaigns with Google Analytics.
You can use the Google Analytics URL Builder to create your campaign tags:
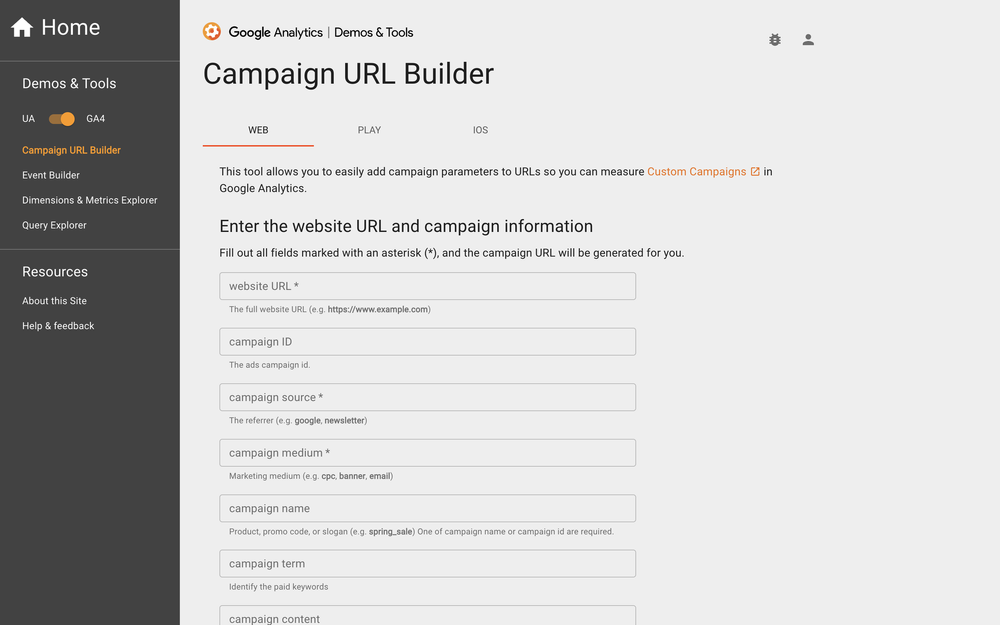
This tool allows you to enter the values for the campaign name, campaign ID, source, medium, and content. Here’s an example for an ad on Facebook:
You need to enter the URL that people are going to click through to from the ad, along with the campaign tags we’ve covered. This will then create a long URL like this one:
https://site.com/spring?utm_source=facebook.com
&utm_medium=paid&utm_campaign=facebook+ads
&utm_id=fb9297
This is the URL that we now use as the destination URL for our ad. When people click on the link they will be taken to the page we defined and the value for each tag will become available in our reports.
Heading to our reports, we will see the following for the people who have clicked through from our ad:
This allows us to see the number of users coming from the ad. The example also includes data from key events (previously called ‘conversions’), allowing us to understand how successful our ads are at driving important actions. And while I’ve used key events in this example, this could just as easily be revenue if you’ve implemented ecommerce tracking on your website.
Getting campaign tags right for ads on social networks
There are different suggestions for how to name campaign tags for social media platforms, but the best approach I’ve found for tracking inbound traffic from ads on social is to make sure you identify the source as the social network’s domain name and the medium as paid. Here’s an example of how I’d campaign tag an ad on LinkedIn:
Campaign: linkedin ads
Source: linkedin․com
Medium: paid
Content: learn more
And here’s an example of how I would campaign tag a similar ad on Facebook:
Campaign: facebook ads
Source: facebook․com
Medium: paid
Content: learn more
Take note of how I always use the domain name as the source and ‘paid’ as the medium. This means Google Analytics will know that clicks are actually coming from social networks (and not another type of campaign). It also means that when tracking social traffic, Google’s built-in default channel group will automatically recognize the traffic is from the ‘Paid Social’ channel.
If you used different campaign tags, then Google might not automatically pick up that the traffic is from a social channel. For example, if you use a source of say ‘fbook’ and the medium ‘post’, then you might not see this traffic correctly assigned to a default channel group in your reports.
What’s changed between GA4 and Universal Analytics?
There are a couple of important differences between how social traffic is tracked and reported in Google Analytics 4 (GA4) compared to Universal Analytics, which is the previous version of Google Analytics.
The first difference is that GA4 automatically identifies organic and paid social traffic, so you will see ‘Organic Social’ and ‘Paid Social’ in your reports. While Universal Analytics combined all social traffic as ‘Social’ by default. This means that my recommendation for identifying paid social traffic has changed with GA4.
GA4 will automatically identify paid social traffic when the source is a social network, and the medium matches the following regular expression:
^(.*cp.*|ppc|retargeting|paid.*)$
This is why I recommend setting the medium to ‘paid’ for your paid social traffic with GA4.
Comparing your paid and organic social media efforts
Now that we’ve campaign tagged our paid ads correctly and remembering back to our Twitter example at the start of this post, you will be able to compare your paid and organic efforts.
Let’s have a look at a Facebook example to understand how this works. Here is the ‘Traffic Acquisition’ report modified to include ‘Session Source’ and ‘Session Medium’:
It shows us our organic and paid traffic coming from Facebook.
We can see facebook․com / referral which is all the traffic coming from my organic (free) social posts. And we can also see facebook․com / paid which we know is from my campaign tagged URL for my paid ads. We can see organic and paid traffic in our reports.
We can then use the default ‘Traffic Acquisition’ report, which includes the ‘Session Primary Default Channel Group’ dimension. This will then automatically classify all of our social traffic as either ‘Organic Social’ or ‘Paid Social’:
So remember you can always change the dimensions used in the default reports to change what is presented in your reports.
Social reports in Google Analytics
Apart from the standard reports in Google Analytics 4 (GA4), you can also navigate to the ‘Advertising’ section to view the attribution reports. In the following example, we’re looking at the ‘Advertising Snapshot’ that also includes social traffic.
And the next step, is to create your own social reports in Google Analytics 4 (GA4) by navigating to ‘Explore’. You can create exploration reports to present your social traffic in a table, a funnel, a path, and other visualizations.
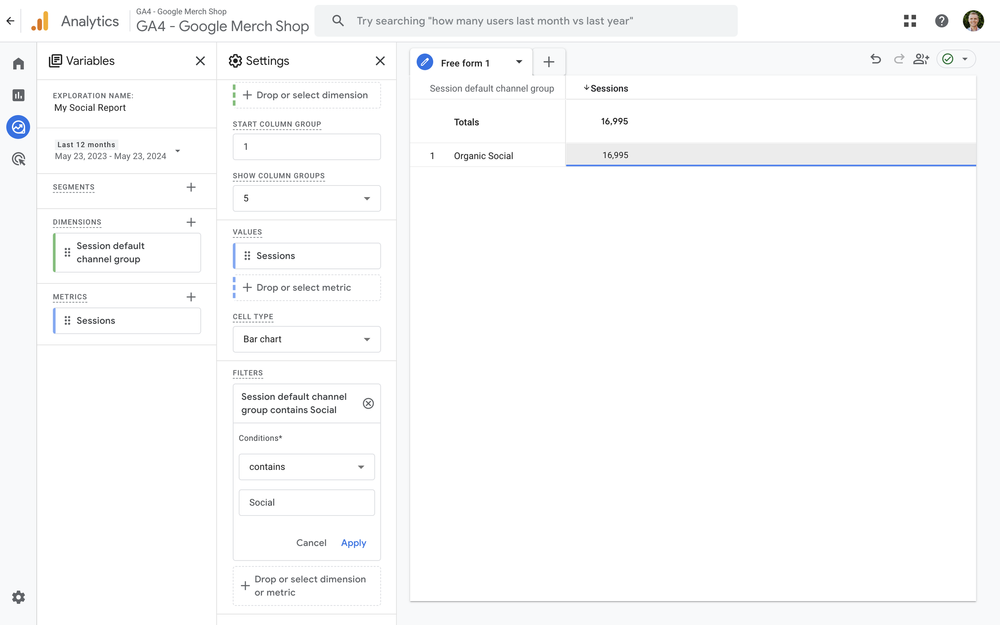
The main thing you’ll need to do to only include your social traffic in exploration reports is apply a filter to the report. To do this, ensure that you have enabled the ‘Session Default Channel Group’ dimension (you can also use ‘Default Channel Group’ or ‘First User Default Channel Group’ depending on what you want included in your report). Then add a filter like this:
Dimension: Session Default Channel Group
Matching: Contains
Value: Social
This will mean your report will include your organic and paid social traffic (and you can adjust the filter if you only want to focus on one of these channels).
Here’s an example that shows you what the filter should look like:
Interpreting social media data in Google Analytics
The first thing to remember when using the reports we’ve just covered is that all of the information is collected on your website. So when you’re interpreting reports, remember you’re only looking at onsite data.
Then you need to consider the objectives you’ve set for the content and ads you’re posting on social networks. Are you aiming to drive audience engagement? Leads? Sales? Or something else? You need to apply context when interpreting and analyzing results.
Some metrics and dimensions you might consider using include:
-
Active Users and Sessions to understand which social networks are sending the most traffic to your website.
-
Key Events, Key Event Rate and Key Event Value are useful metrics if you’re aiming for social networks to drive direct action on your website.
-
Ecommerce Purchases and Ecommerce Revenue to understand if people are purchasing after finding your website on a social network.
-
Source, Medium, and Default Channel Group as we’ve already covered. And I recommend starting with the session-based dimensions.
Tracking social sharing widgets on your website
What exactly do people share on your website?
When it comes to Google Analytics, there are a few options to track what people are sharing. We can view details about our inbound social traffic using the reports, as we’ve already covered. This lets us identify the social media platforms that are sending traffic to our website. And this also lets us see the pages people land on and where they travel to on our website.
On top of that, we have the ability to track outbound social actions. What exactly does "outbound" mean, you ask? For example, if you have a Facebook "like" button on one of your blog posts, you can use Google Analytics to track the actions people take with these sharing widgets.
However, there is one drawback – monitoring social sharing widgets does not happen automatically. You will need to adjust your implementation so that Google Analytics can collect this data for your reports.
This is why you might want to consider a solution like AddToAny which lets you easily add social sharing options to your website. You’ll have social sharing on your website in no time and we can also track actions into Google Analytics using their Google Tag Manager integration.
Here’s an example in Google Tag Manager that will send a ‘share’ event to Google Analytics:
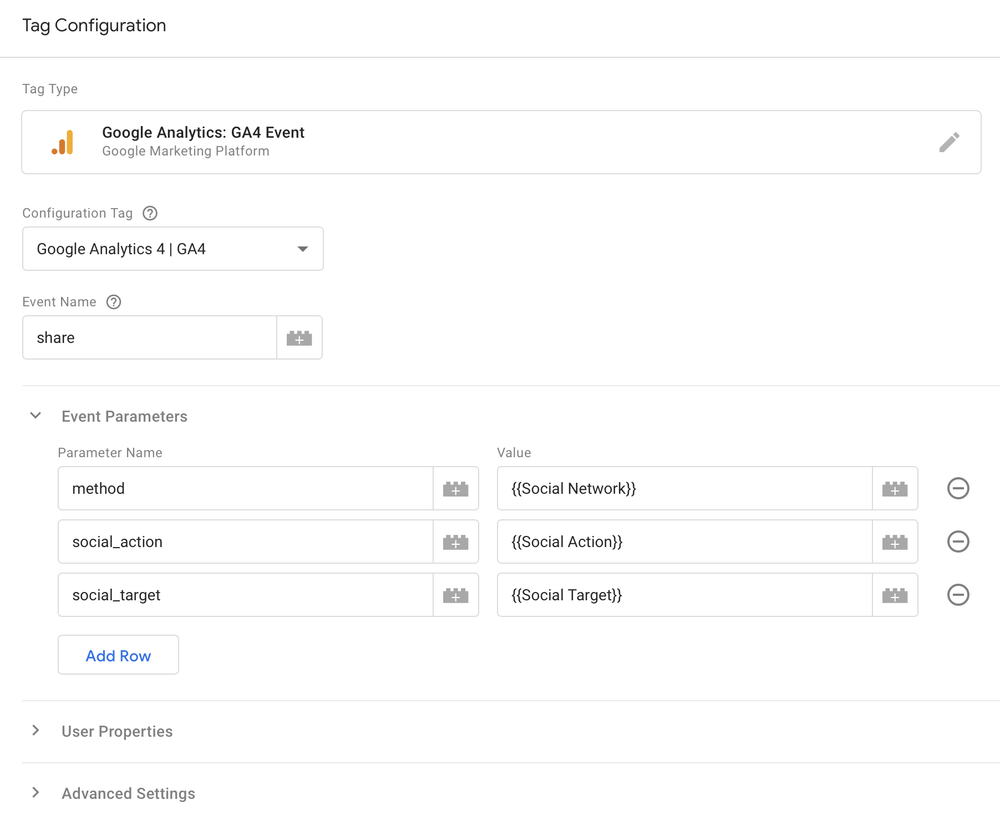
This example is based on the integration instructions for AddToAny and modified for GA4. Once published, you will then be able to see people sharing your content on Twitter, LinkedIn, Pinterest and all of the other social networks using AddToAny.
Sharing platforms and data privacy
I do want to highlight that when adding any third-party script to your website it’s important to understand how data will be collected, processed, stored and used. While AddToAny says they are GDPR and CCPA friendly, they are collecting data from your website. AddToAny’s privacy policy says:
In order to provide certain services, you must allow us to use raw data related to the use and distribution of Your Content ("Data") that will be collected as part of the services. You hereby grant AddToAny a non-exclusive, perpetual, worldwide and irrevocable right and license to utilize the Data to track, extract, compile, synthesize, aggregate, and analyze such Data, including, but not limited to, the creation of anonymous or pseudonymous usage data ("Usage Data"). We reserve the right to use, reproduce, distribute and display Usage Data, in our sole discretion.
This means you need to be comfortable with your data being used by a third party. If you’d prefer to keep your data private, then you’ll need to use another solution. I’ve switched to Social Share Kit which means the script is self-hosted and I can configure Google Tag Manager to track people engaging with my social sharing widget.
Tracking dark social (and what it is)
We’ve covered inbound social traffic, but there’s still a gap in what we’ll be looking at when it comes to our Google Analytics reports. This is called dark social. Sounds scary!
Dark social refers to traffic that originates from social networks that can’t be tracked. This might sound strange, but think about this scenario…
You share a link to your website on Twitter. Someone clicks that link and copies the URL of the page. They then email that link to a friend who clicks through to your website too.
Social media has played a role in getting both of these people to your website, but only the first person is counted as coming from Twitter. The second person is seen as direct without any detail about how the link was shared.
This is dark social.
So how can we measure this?
One solution is to use a tool like AddThis which gives you the ability to understand the number of people copying URLs from your website and sharing them. To configure this using AddThis you’ll need to adjust their code. From there you’ll be able to see the number of shares of your content, even if they don’t come back directly from a social network. Here you can see the report from AddThis:
The way this works is that AddThis adds extra information to the end of the URLs as people visit your website. This information (hashtag) means that when someone copies and pages that URL the share can be reported. This gives you some clarity into people that are copying and pasting the URL from your website.
To enable this feature you need to add the following configuration:
var addthis_config = {
  data_track_addressbar: true
}
The downside of using AddThis is that they collect and use your data in order to monetize their free service. I’ve played with their address bar tracking solution (and other solutions) in the past, but I’ve found the reports to be of minimal value. Instead of handing over your data and making your URLs stranger than they already are, I recommend keeping things simple.
So try this…
Create an exploration report and apply a segment that only includes direct traffic, but excludes pages with URLs that are easy for people to remember, like your website’s homepage. It’s unlikely that someone is actually typing in a super long URL, like the URL to one of your blog posts. It’s more likely that they’ve clicked a link that someone has shared with them. Using this report you’ll now have an idea of the content that people are sharing with their contacts.
Importance of native social analytics
Then there’s native analytics, or the analytics built into each social network.
It’s important to recognize that Google Analytics will not be able to track everything. For example, we can’t install the Google Analytics tracking code on our Facebook page or add it to our individual posts. Social networks are not going to let us add the tracking code, so we can’t measure actions taking place inside social networks using Google Analytics (although it would be awesome).
What we need to do is complement what we’re doing with Google Analytics with native analytics from each social network we use.
One example of this is when you want to understand the performance of your content within a social network. We’re not always creating social ads designed to get people to click through to our website. Instead, we might be aiming to engage with our audience inside the social network. By using the in-built analytics we can understand which pieces of content are more (or less) engaging.
I’m going to use Twitter as my next example.
When we post content on Twitter some people will click through to my website, but I also need to understand the performance and impact of my post even if people don’t click through.
Why?
Well, I need to know what to post next. Here I can see a post that has 61 likes, 17 retweets and one comment.
I can instantly see what is driving engagement and this tells me the type of content we should be posting.
The same is true for each social network you use, whether it’s Facebook, Instagram, Twitter, or LinkedIn. You need to determine which pieces of content are generating the most engagement. This allows us to supplement our Google Analytics reports with native analytics for additional insights into our performance.
Here are my top tips when it comes to using native analytics…
-
You can utilize native analytics to get a better understanding of your most engaging organic content within the individual social networks.
-
Use native analytics if you are promoting a post on Twitter, Facebook, or other social media platform to boost the number of likes. So whenever you’re not running a clicks campaign.
-
Use native analytics to review the cost-based performance of your ads.
Using click analytics for insights
Finally, I wanted to mention click analytics for your social posts.
Yes, you can certainly jump into the native tools themselves, but if you want to get details about what people are clicking on, especially if you’re creating lots of content, for example, on Twitter, there’s going to be lots and lots of data to review, so you need a quick, simple way to understand what’s engaging.
Platforms like Buffer let you to schedule your social posts. And these types of scheduling solutions generally include their own analytics based on people clicking shortened URLs. For example, the analytics section of Buffer lets you understand which pieces of content are most engaging for your audience.
There are some good options in Buffer. You can sort by what’s popular, so by comments or likes or clicks, or you can also sort by your least popular posts too. You can then learn from this to understand, "Well, what can I do more of and what should I potentially be doing less of when it comes to my social posting?" I’m definitely a big fan of quick insights.
Conclusion
Google Analytics will provide some great insights into the social media platforms sending traffic to your website. You can then expand on the data being collected by using campaign tagged URLs and measuring how people engage with social widgets on your website.
You’re on your way to tracking social media with Google Analytics!
Plus, you are also aware of the limitations of Google Analytics. You know that you can supplement Google Analytics with data directly from social networks. Keep in mind that this is critical for analyzing the performance of your content within the social networks themselves.
Start finding the insights you need to improve your social content. I recommend you begin by asking yourself the simple questions of “What is working?” and “What isn’t working?”
You’ve got this!