Originally Posted on Actionable SEO Tips and Strategies That Work by Vahan Petrosyan
AI is shaping every field by making skills (such as coding or data visualization) accessible to everyone, which weren’t available in the past.
An AI operator who can run the right prompts can perform low- and medium-level difficulty tasks, allowing more focus on strategic decision-making.
In this guide, we will walk you through step by step how to use AI chatbots with ChatGPT as an example to run complex BigQuery queries for your SEO reporting needs.
We will review two examples:
It will also give you an overall idea of how you can use chatbots to reduce the burden when running SEO reports.
Why Do You Need To Learn BigQuery?
SEO tools like Google Search Console or Google Analytics 4 have accessible user interfaces you can use to access data. But often, they limit what you can do and show incomplete data, which is usually called data sampling.
In GSC, this happens because the tool omits anonymized queries and limits table rows to up to 1,000 rows.
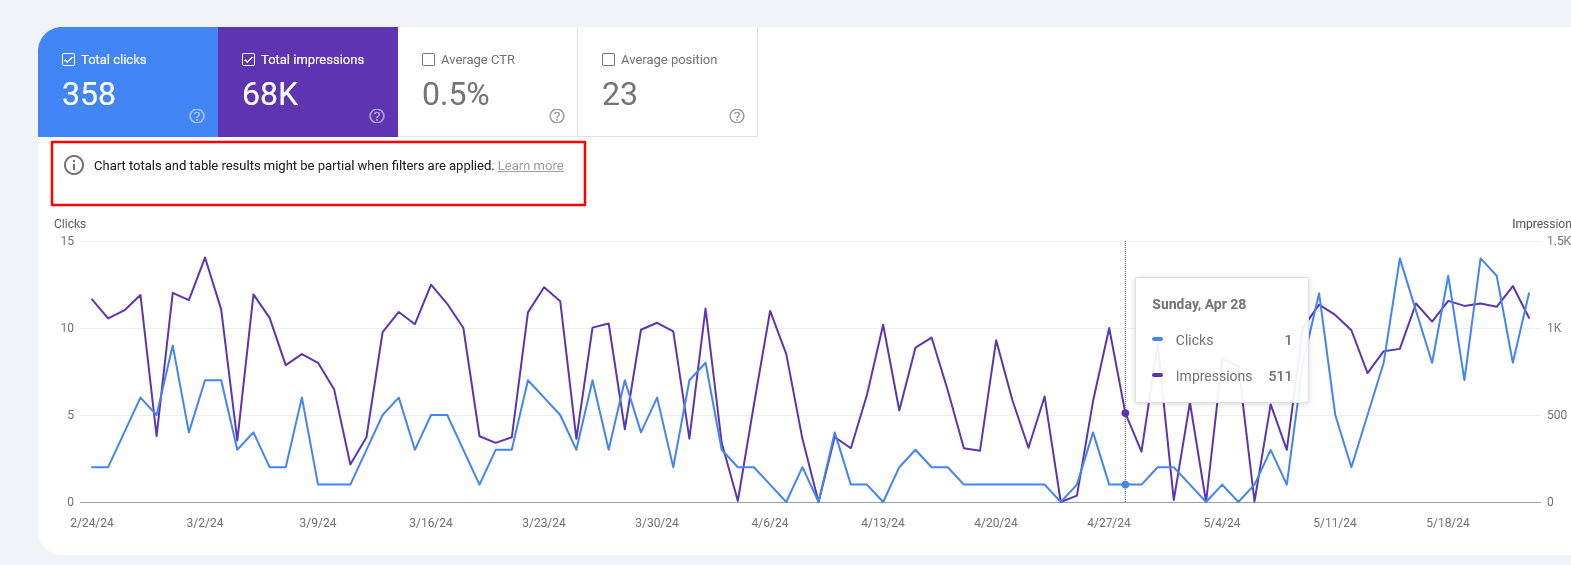 Screenshot from Google Search Console, May 2024
By using BigQuery, you can solve that problem and run any complex reports you want, eliminating the data sampling issue that occurs quite often when working with large websites.
(Alternatively, you may try using Looker Studio, but the purpose of this article is to illustrate how you can operate ChatGPT for BigQuery.)
For this article, we assume you have already connected your GSC and GA4 accounts to BigQuery. If you haven’t done it yet, you may want to check our guides on how to do it:
SQL Basics
If you know Structured Query Language (SQL), you may skip this section. But for those who don’t, here is a quick reference to SQL statements:
| Statement | Description |
| SELECT | Retrieves data from tables |
| INSERT | Inserts new data into a table |
| UNNEST | Flattens an array into a set of rows |
| UPDATE | Updates existing data within a table |
| DELETE | Deletes data from a table |
| CREATE | Creates a new table or database |
| ALTER | Modifies an existing table |
| DROP | Deletes a table or a database. |
The conditions we will be using so you can familiarize yourself:
| Condition | Description |
| WHERE | Filters records for specific conditions |
| AND | Combines two or more conditions where all conditions must be true |
| OR | Combines two or more conditions where at least one condition must be true |
| NOT | Negates a condition |
| LIKE | Searches for a specified pattern in a column. |
| IN | Checks if a value is within a set of values |
| BETWEEN | Select values within a given range |
| IS NULL | Checks for null values |
| IS NOT NULL | Checks for non-null values |
| EXISTS | Checks if a subquery returns any records |
Now, let’s dive into examples of how you can use BigQuery via ChatGPT.
1. How To Analyze Traffic Decline Because Of Google Algorithm Impact
If you have been affected by a Google algorithm update, the first thing you should do is run reports on affected pages and analyze why you have been impacted.
Remember, the worst thing you can do is start changing something on the website right away in panic mode. This may cause fluctuations in search traffic and make analyzing the impact even harder.
If you have fewer pages in the index, you may find using GSC UI data satisfactory for analyzing your data, but if you have tens of thousands of pages, it won’t let you export more than 1,000 rows (either pages or queries) of data.
Say you have a week of data since the algorithm update has finished rolling out and want to compare it with the previous week’s data. To run that report in BigQuery, you may start with this simple prompt:
Imagine you are a data analyst experienced in Google Analytics 4 (GA4), Google Search Console, SQL, and BigQuery.
Your task is to generate an SQL query to compare 'WEB' Search Console data for the periods '2024-05-08' to '2024-05-20' and '2024-04-18' to '2024-04-30'.
Extract the total clicks, impressions, and average position for each URL for each period.
Additionally, calculate the differences in these metrics between the periods for each URL
(where average position should be calculated as the sum of positions divided by the sum of impressions).

Details:

BigQuery project name: use_your_bigquery_projectname
Dataset name: searchconsole
Table name: searchdata_url_impression
Please provide the SQL query that meets these requirements.
Once you get an SQL code, copy and paste it into the BigQuery SQL editor, but I bet the initial code you will get will have errors. For example, table column names may not match what is in your BigQuery dataset.
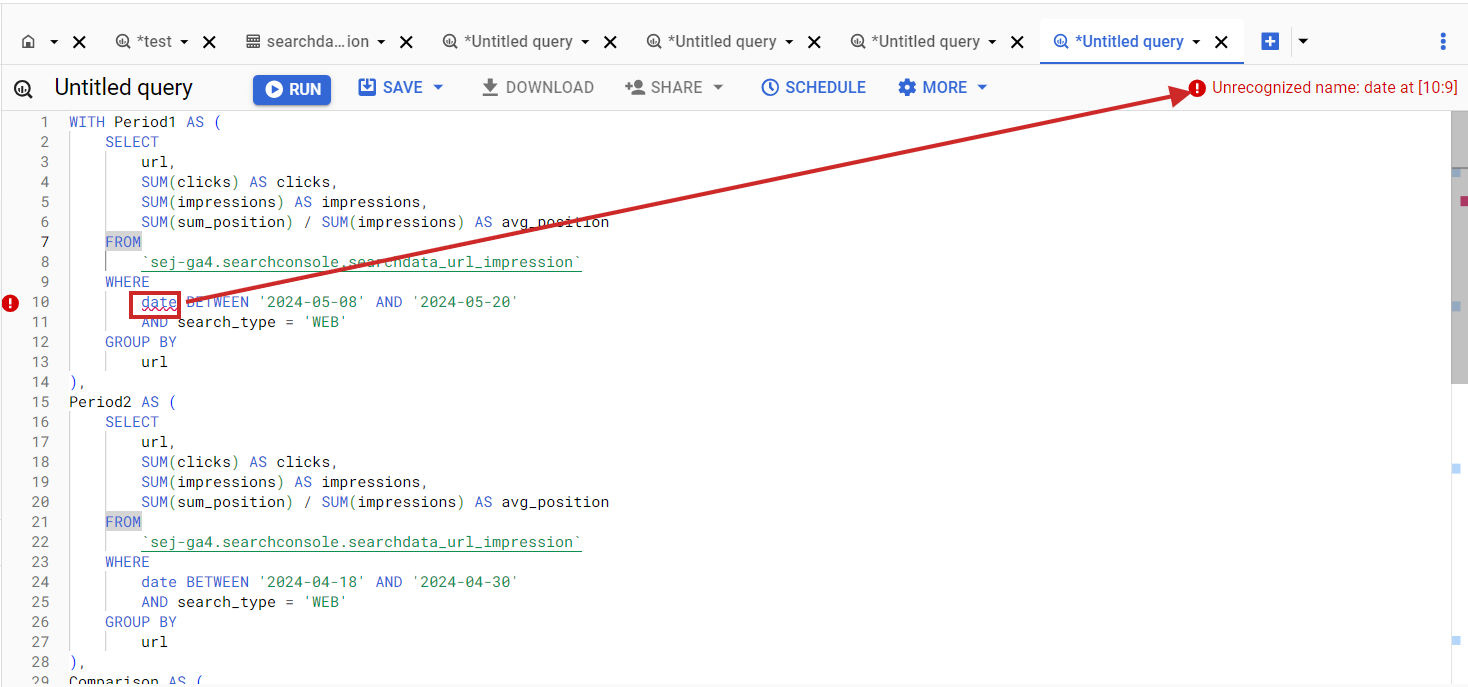 Error in BigQuery SQL when column name doesn’t match the dataset column.
Things like this happen quite often when performing coding tasks via ChatGPT. Now, let’s dive into how you can quickly fix issues like this.
Simply click on your dataset in the left-right panel, select all columns on the right side, and click Copy as Table.
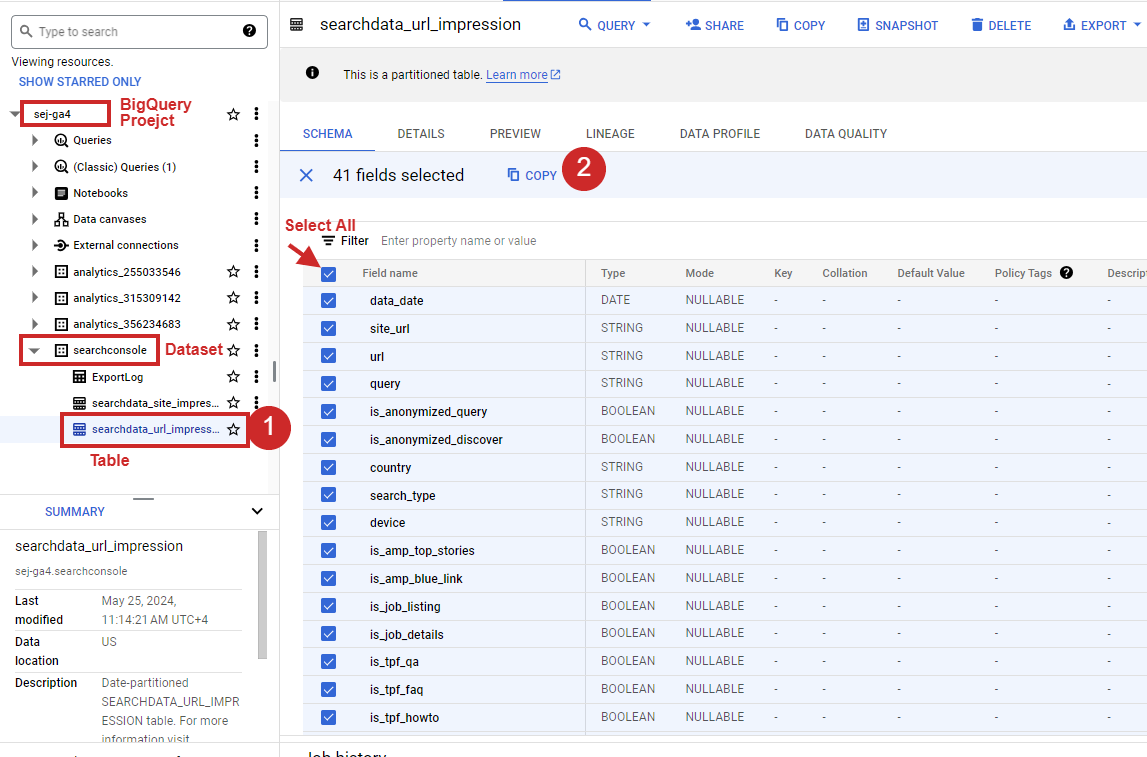 How to select all columns of the table in BigQuery.
Once you have it, just copy and paste it as a follow-up prompt and hit enter.
Generate SQL again by taking into account that my table schema is as follows :
"fullname mode type description
data_date DATE
site_url STRING
url STRING
query STRING
is_anonymized_query BOOLEAN
is_anonymized_discover BOOLEAN
country STRING
search_type STRING
device STRING
is_amp_top_stories BOOLEAN
is_amp_blue_link BOOLEAN
is_job_listing BOOLEAN
is_job_details BOOLEAN
is_tpf_qa BOOLEAN
is_tpf_faq BOOLEAN
is_tpf_howto BOOLEAN
is_weblite BOOLEAN
is_action BOOLEAN
is_events_listing BOOLEAN
is_events_details BOOLEAN
is_search_appearance_android_app BOOLEAN
is_amp_story BOOLEAN
is_amp_image_result BOOLEAN
is_video BOOLEAN
is_organic_shopping BOOLEAN
is_review_snippet BOOLEAN
is_special_announcement BOOLEAN
is_recipe_feature BOOLEAN
is_recipe_rich_snippet BOOLEAN
is_subscribed_content BOOLEAN
is_page_experience BOOLEAN
is_practice_problems BOOLEAN
is_math_solvers BOOLEAN
is_translated_result BOOLEAN
is_edu_q_and_a BOOLEAN
impressions INTEGER
clicks INTEGER
sum_position INTEGER
is_product_snippets BOOLEAN
is_merchant_listings BOOLEAN
is_learning_videos BOOLEAN "
This will fix the generated SQL according to the GSC table structure as follows:
WITH period1 AS (
 SELECT
   url,
   SUM(clicks) AS clicks,
   SUM(impressions) AS impressions,
   IFNULL(SUM(sum_position) / NULLIF(SUM(impressions), 0), 0) AS avg_position
 FROM
   `use_your_bigquery_projectname.searchconsole.searchdata_url_impression`
 WHERE
   data_date BETWEEN '2024-05-08' AND '2024-05-20'
 AND search_type = 'WEB'
  GROUP BY
  url
),
period2 AS (
 SELECT
  url,
  SUM(clicks) AS clicks,
  SUM(impressions) AS impressions,
  IFNULL(SUM(sum_position) / NULLIF(SUM(impressions), 0), 0) AS avg_position
 FROM
  `use_your_bigquery_projectname.searchconsole.searchdata_url_impression`
  WHERE
  data_date BETWEEN '2024-04-18' AND '2024-04-30'
 AND search_type = 'WEB'
 GROUP BY
 url
),
comparison AS (
 SELECT
  COALESCE(p1.url, p2.url) AS url,
  IFNULL(p1.clicks, 0) AS clicks_period1,
  IFNULL(p2.clicks, 0) AS clicks_period2,
  IFNULL(p1.impressions, 0) AS impressions_period1,
  IFNULL(p2.impressions, 0) AS impressions_period2,
  IFNULL(p1.avg_position, 0) AS avg_position_period1,
  IFNULL(p2.avg_position, 0) AS avg_position_period2,
  IFNULL(p1.clicks, 0) - IFNULL(p2.clicks, 0) AS clicks_diff,
  IFNULL(p1.impressions, 0) - IFNULL(p2.impressions, 0) AS impressions_diff,
  IFNULL(p1.avg_position, 0) - IFNULL(p2.avg_position, 0) AS avg_position_diff
 FROM
  period1 p1
 FULL OUTER JOIN
   period2 p2
 ON
  p1.url = p2.url
)
SELECT
 url,
 clicks_period1,
 clicks_period2,
 clicks_diff,
 impressions_period1,
 impressions_period2,
 impressions_diff,
 avg_position_period1,
 avg_position_period2,
 avg_position_diff
FROM
 comparison
ORDER BY
 url;
Now, run it and enjoy the data either by exporting it into the CSV or Google Sheets.
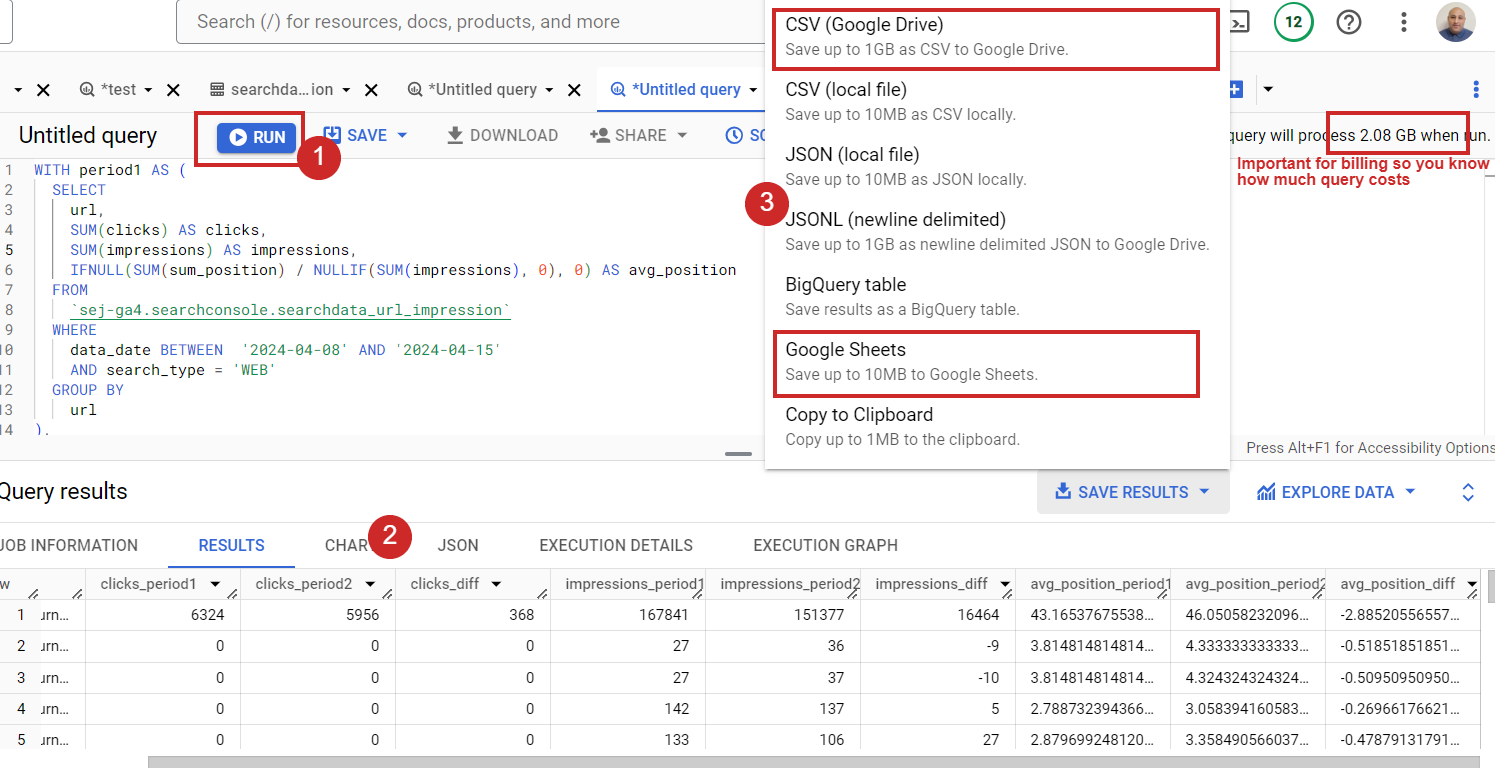 How to run SQL in BigQuery.
In case you have millions of URLs, you may not be able to work in Google Sheets or CSV export because the data is too big. Plus, those apps have limitations on how many rows you can have in a single document. In that case, you can save results as a BigQuery table and connect to it with Looker Studio to view the data.
But please remember that BigQuery is a freemium service. It is free up to 1 TB of processed query data a month. Once you exceed that limit, your credit card will be automatically charged based on your usage.
That means if you connect your BigQuery to Looker Studio and browse your data there, it will count against your billing every time you open your Looker dashboard.
That is why, when exports have a few tens of thousands or hundreds of thousands of rows, I like using Google Sheets. I can easily connect it to Looker Studio for data visualization and blending, and this will not count against my billing.
If you have ChatGPT Plus, you can simply use this custom GPT I’ve made, which takes into account table schemas for GA4 and Search Console. In the above guide, I assumed you were using the free version, and it illustrated how you can use ChatGPT overall for running BigQuery.
In case you want to know what is in that custom GPT, here is the screenshot of the backend.
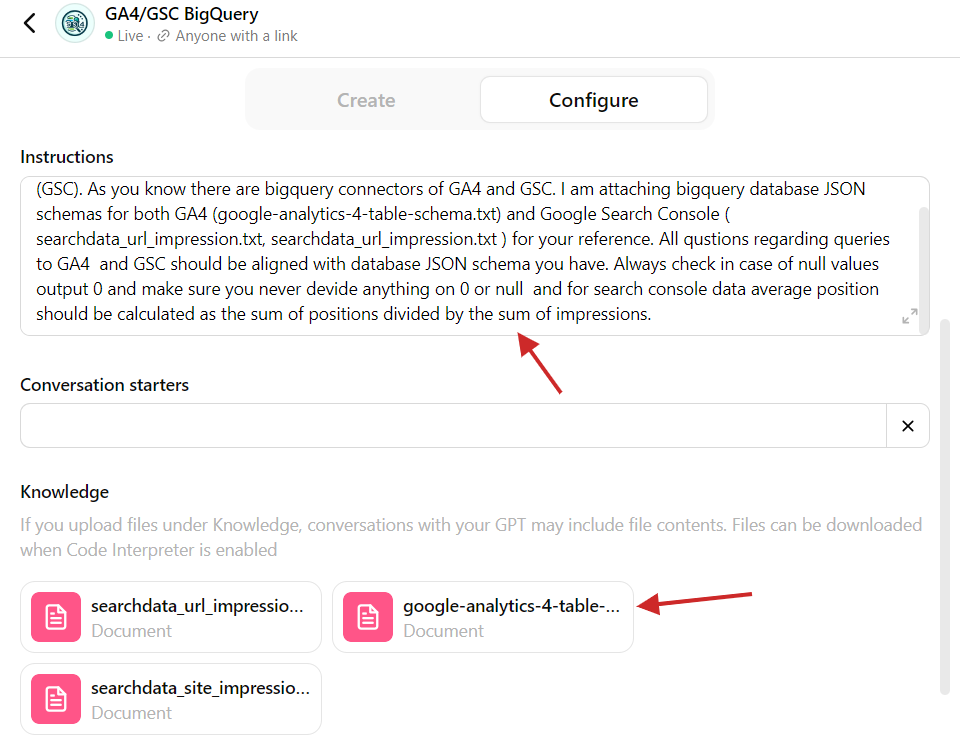 Custom GPT with BigQuery table schemas.
Nothing complicated – you just need to copy tables from BigQuery as JSON in the step explained above and upload them into the custom GPT so it can refer to the table structure. Additionally, there is a prompt that asks GPT to refer to the JSON files attached when composing queries.
This is another illustration of how you can use ChatGPT to perform tasks more effectively, eliminating repetitive tasks.
If you need to work with another dataset (different from GA4 or GSC) and you don’t know SQL, you can upload the table schema from BigQuery into ChatGPT and compose SQLs specific to that table structure. Easy, isn’t it?
As homework, I suggest you analyze which queries have been affected by AI Overviews.
There is no differentiator in the Google Search Console table to do that, but you can run a query to see which pages didn’t lose ranking but had a significant CTR drop after May 14, 2024, when Google introduced AI Overviews.
You can compare the two-week period after May 14th with the two weeks prior. There is still a possibility that the CTR drop happened because of other search features, like a competitor getting a Featured Snippet, but you should find enough valid cases where your clicks were affected by AI Overviews (formerly Search Generative Experience or “SGE”).
2. How To Combine Search Traffic Data With Engagement Metrics From GA4
When analyzing search traffic, it is vital to understand how much users engage with content because user engagement signals are ranking factors. Please note that I don’t mean the exact metrics defined in GA4.
However, GA4’s engagement metrics – such as “average engagement time per session,” which is the average time your website was in focus in a user’s browser – may hint at whether your articles are good enough for users to read.
If it is too low, it means your blog pages may have an issue, and users don’t read them.
If you combine that metric with Search Console data, you may find that pages with low rankings also have a low average engagement time per session.
Please note that GA4 and GSC have different attribution models. GA4 uses last data-driven or last-click attribution models, which means if one visits from Google to an article page once and then comes back directly two more times, GA4 may attribute all three visits to Google, whereas GSC will report only one.
So, it is not 100% accurate and may not be suitable for corporate reporting, but having engagement metrics from GA4 alongside GSC data provides valuable information to analyze your rankings’ correlations with engagement.
Using ChatGPT with BigQuery requires a little preparation. Before we jump into the prompt, I suggest you read how GA4 tables are structured, as it is not as simple as GSC’s tables.
It has an event_params column, which has a record type and contains dimensions like page_location, ga_session_id, and engagement_time_msec. It tracks how long a user actively engages with your website.
event_params key engagement_time_msec is not the total time on the site but the time spent on specific interactions (like clicking or scrolling), when each interaction adds a new piece of engagement time. It is like adding up all the little moments when users are actively using your website or app.
Therefore, if we sum that metric and average it across sessions for the pages, we obtain the average engagement time per session.
Now, once you understand engagement_time_msec , let’s ask ChatGPT to help us construct a query that pulls GA4 “average engagement time per session” for each URL and combines it with GSC search performance data of articles.
The prompt I would use is:
Imagine you are a data analyst experienced in Google Analytics 4 (GA4), Google Search Console, SQL, and BigQuery.
Compose a SQL query that pulls the following data from Google Search Console for each URL for the previous 7 days, excluding the current day:

1. Clicks,
2. Impressions,
3. Average position (calculated as the sum of positions divided by the sum of impressions).

From GA4 BigQuery table unnest from event_params ga_session_id, engagement_time_msec and page_location.
Select only rows which have engagement_time_msec set as not null group all sessions with the same IDs and page_location and SUM engagement_time_msec and devides to SUM of sessions number

Join GA4 and Google Search Console data by URLs for the same period.
Additonally Optimize the query to pull from GA4's table partitions and not query the entire table.

Details:
1. BigQuery project name: use_your_bigquery_projectname
2. GA4 dataset name: use_your_ga4_bigquery_dataset_name
3. GA4 table name: use_your_ga4_bigquery_table_name_under_dataset
3. Google Search Console dataset name: use_your_gsc_bigquery_table_name_under_dataset
3. Google Search Console table name: use_your_gsc_bigquery_table_name_under_dataset
4. Here is BigQuery tables schemas for GA4: [copy table schema here]
5. Here is BigQuery tables schemas for Google Search Console: [copy table schema here]
Once I copied and pasted into BigQuery, it gave me results with “average engagement time per session” being all nulls. So, apparently, ChatGPT needs more context and guidance on how GA4 works.
I’ve helped to provide additional knowledge as a follow-up question from GA4’s official documentation on how it calculates engagement_time_msec. I copied and pasted the document into the follow-up prompt and asked to refer to that knowledge when composing the query, which helped. (If you get any syntax error, just copy/paste it as a follow-up question and ask to fix it.)
As a result of 15 minutes of effort, I got the right SQL:
WITH
-- Step 1: Filter GA4 data for the last 7 days and unnest event_params
ga4_data AS (
  SELECT
    event_date,
    event_timestamp,
    (SELECT value.int_value FROM UNNEST(event_params) WHERE key = 'ga_session_id') AS ga_session_id,
    (SELECT value.int_value FROM UNNEST(event_params) WHERE key = 'engagement_time_msec') AS engagement_time_msec,
    (SELECT value.string_value FROM UNNEST(event_params) WHERE key = 'page_location') AS page_location
  FROM
    `your_bq_project_name.your_bq_ga4_dataset.events_*`
  WHERE
     _TABLE_SUFFIX BETWEEN FORMAT_DATE('%Y%m%d', DATE_SUB(CURRENT_DATE(), INTERVAL 8 DAY))
    AND FORMAT_DATE('%Y%m%d', DATE_SUB(CURRENT_DATE(), INTERVAL 1 DAY))
    AND (SELECT value.int_value FROM UNNEST(event_params) WHERE key = 'engagement_time_msec') IS NOT NULL
),

-- Step 2: Aggregate GA4 data by session ID and page location
aggregated_ga4_data AS (
  SELECT
    page_location,
    SUM(engagement_time_msec/1000) / NULLIF(COUNT(DISTINCT ga_session_id), 0) AS avg_engagement_time_msec
  FROM
    ga4_data
  GROUP BY
    page_location
),
-- Step 3: Filter GSC data for the last 7 days and select urls which had clicks
gsc_data AS (
  SELECT
    url,
    SUM(clicks) AS clicks,
    SUM(impressions) AS impressions,
    SUM(sum_position) / SUM(impressions) AS avg_position
  FROM
    `your_bq_project_name.searchconsole.searchdata_url_impression`
  WHERE
    data_date BETWEEN DATE_SUB(CURRENT_DATE(), INTERVAL 8 DAY) AND DATE_SUB(CURRENT_DATE(), INTERVAL 1 DAY)
    and
    clicks > 0
  GROUP BY
    url
)

-- Joining Google Search Console data with GA4 data by page_location and url
SELECT
  gsc.url,
  gsc.clicks,
  gsc.impressions,
  gsc.avg_position,
  ga4.avg_engagement_time_msec
FROM
  gsc_data AS gsc
LEFT JOIN
  aggregated_ga4_data AS ga4
ON
  gsc.url = ga4.page_location
ORDER BY
  gsc.clicks DESC;
This pulls GSC data with engagement metrics from GA4.
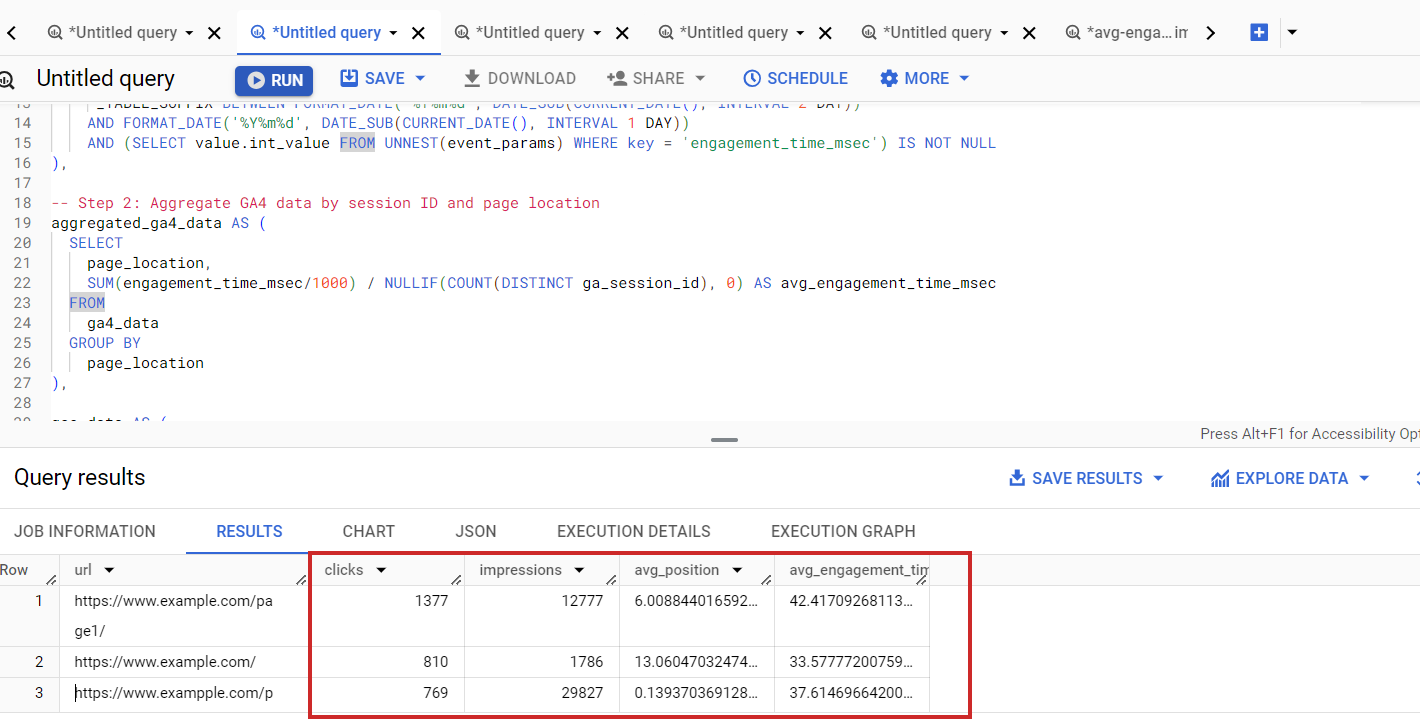 Search Console combined data with GA4
Please note that you might notice discrepancies between the numbers in the GA4 UI and the data queried from BigQuery tables.
This happens because GA4 focuses on “Active Users” and groups rare data points into an “(other)” category, while BigQuery shows all raw data. GA4 also uses modeled data for gaps when consent isn’t given, which BigQuery doesn’t include.
Additionally, GA4 may sample data for quicker reports, whereas BigQuery includes all data. These variations mean GA4 offers a quick overview, while BigQuery provides detailed analysis. Learn a more detailed explanation of why this happens in this article.
Perhaps you may try modifying queries to include only active users to bring results one step closer to GA4 UI.
Alternatively, you can use Looker Studio to blend data, but it has limitations with very large datasets. BigQuery offers scalability by processing terabytes of data efficiently, making it ideal for large-scale SEO reports and detailed analyses.
Its advanced SQL capabilities allow complex queries for deeper insights that Looker Studio or other dashboarding tools cannot match.
Conclusion
Using ChatGPT’s coding abilities to compose BigQuery queries for your reporting needs elevates you and opens new horizons where you can combine multiple sources of data.
This demonstrates how ChatGPT can streamline complex data analysis tasks, enabling you to focus on strategic decision-making.
At the same time, these examples taught us that humans absolutely need to operate AI chatbots because they may hallucinate or produce wrong answers.
More resources:
Featured Image: NicoElNino/Shutterstock


